


Model
one selection
required
priority
- please select one to continue
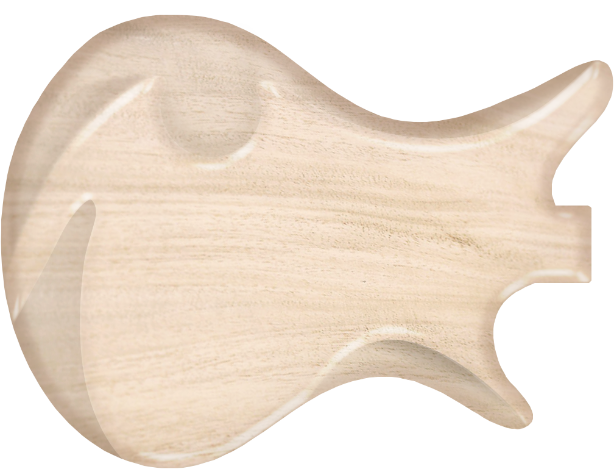
Choose your model.
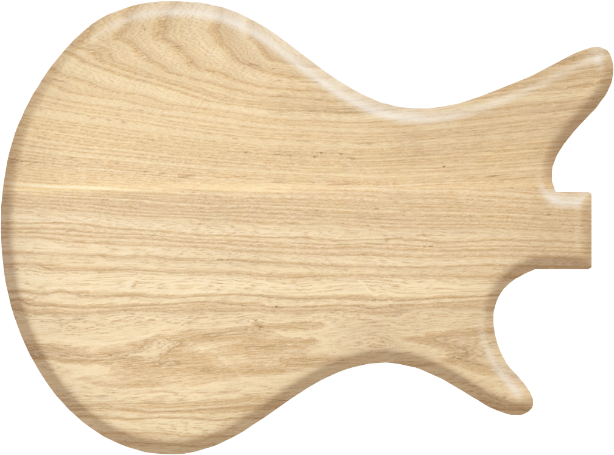
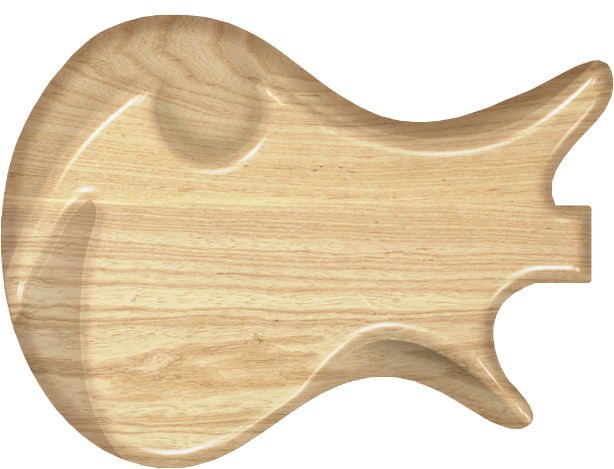
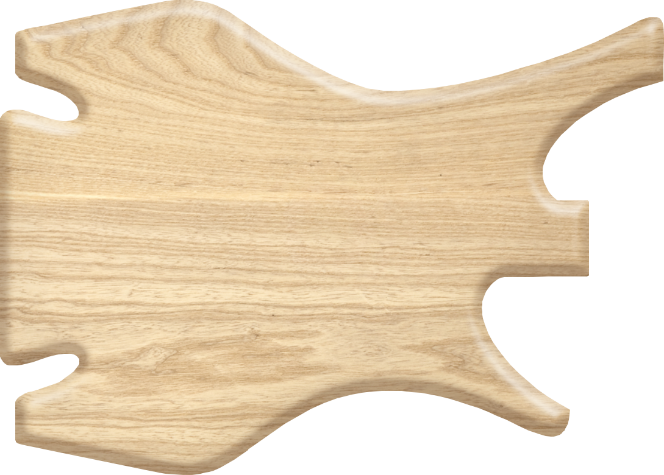
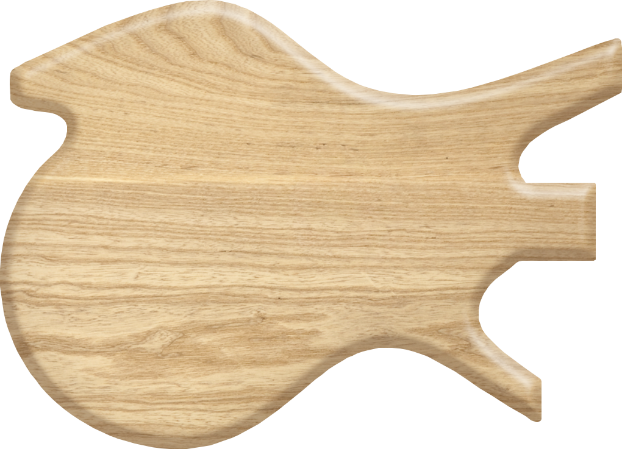
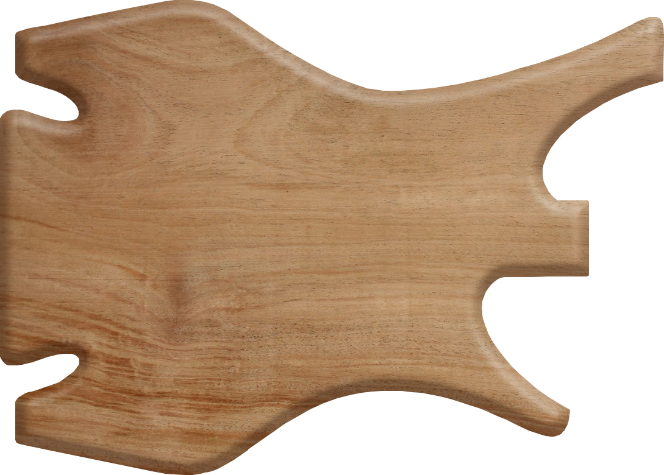
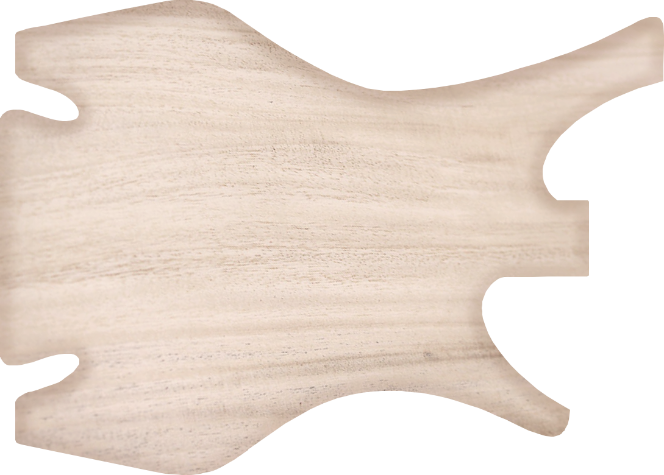
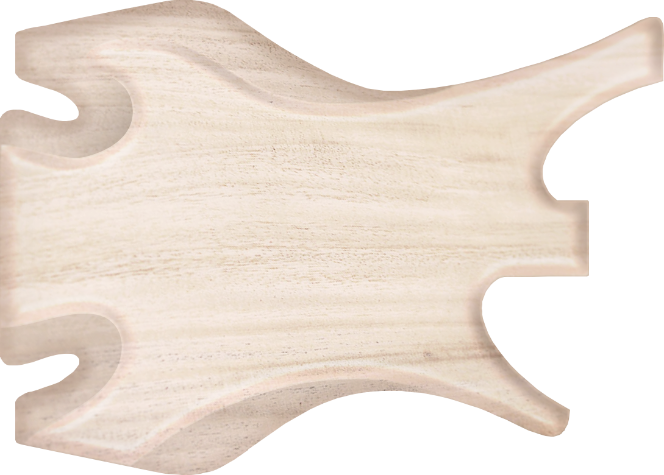
Body Profile
one selection
required
priority
- please select one to continue
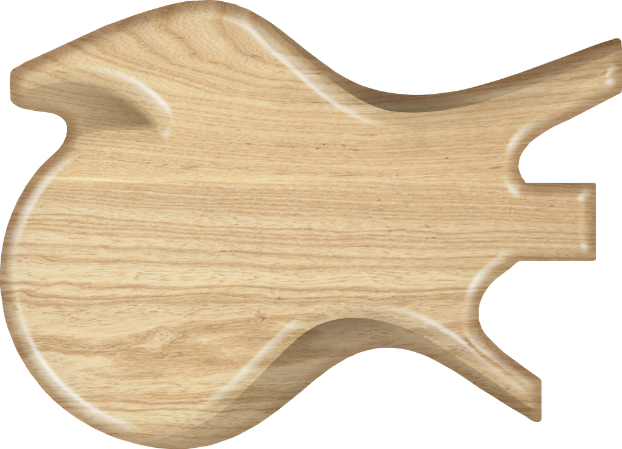
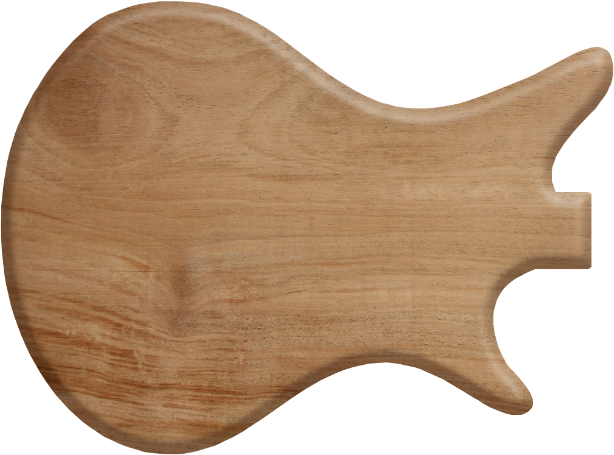
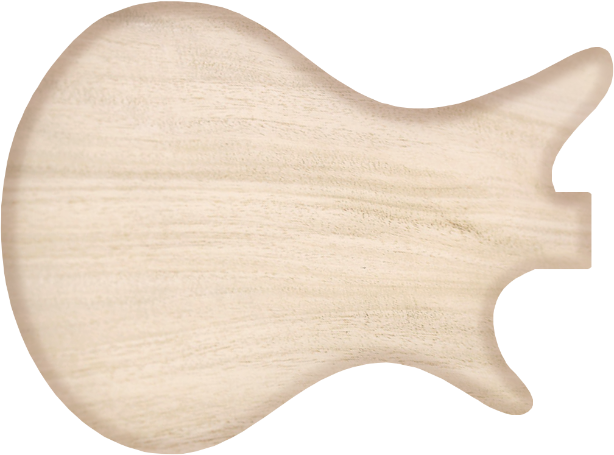
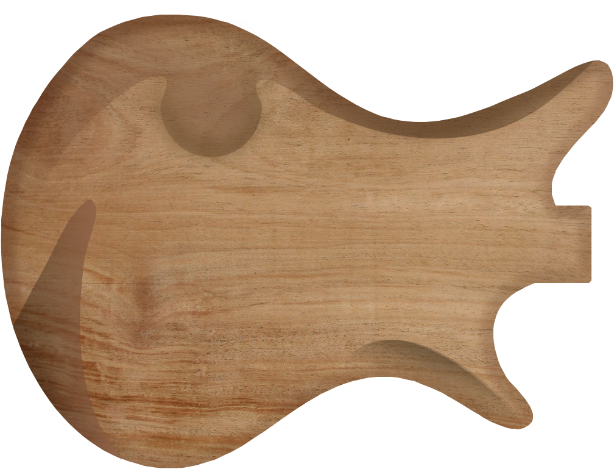
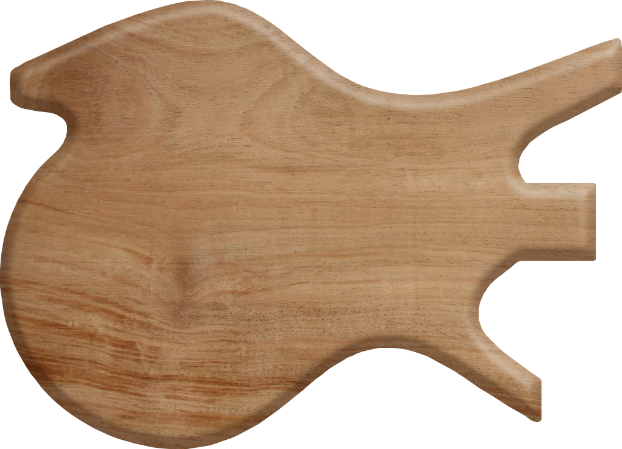
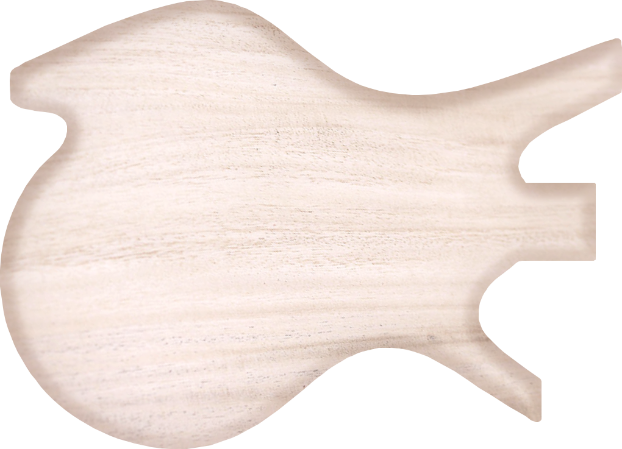
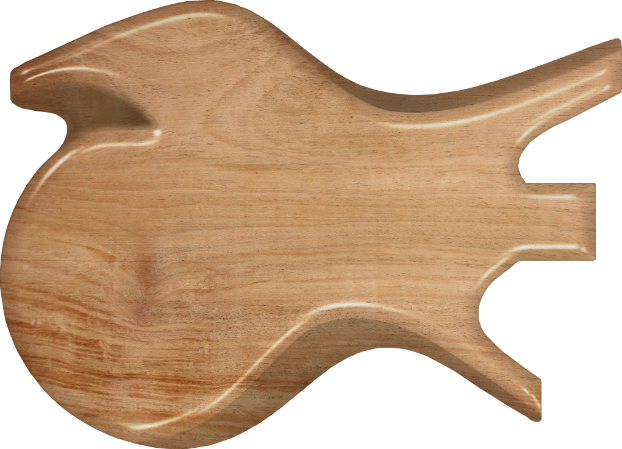
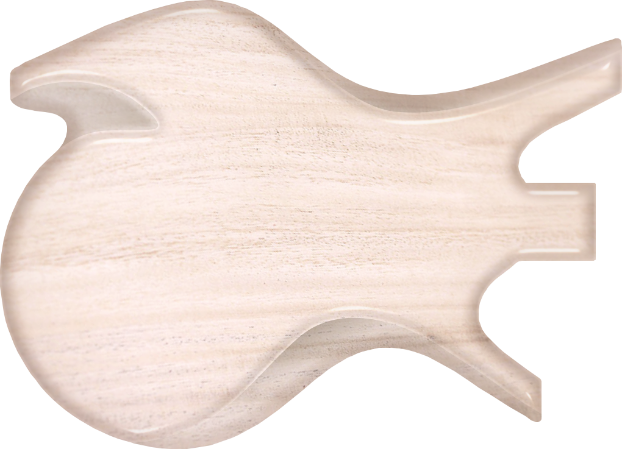
Body
one selection
required
priority
- please select one to continue
Choose some wood for your guitar body.
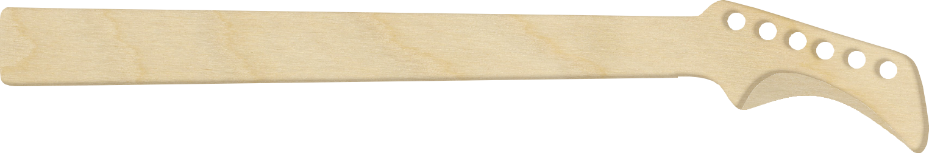
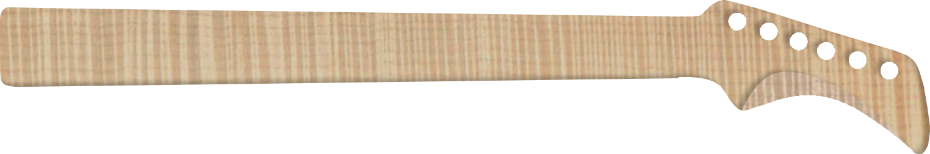
Neck
one selection
required
priority
- please select one to continue
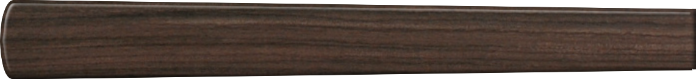
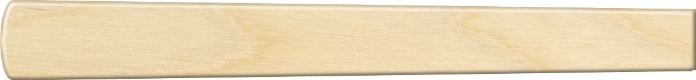
Fretboard
one selection
required
priority
- please select one to continue
Inlays
one selection
required
priority
- please select one to continue
Frets
one selection
required
priority
- please select one to continue
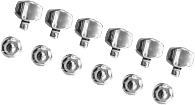
Tuners
one selection
required
priority
- please select one to continue
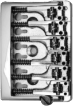
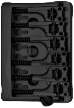
Bridge
one selection
required
priority
- please select one to continue
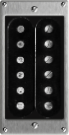
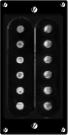
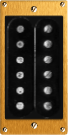
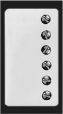
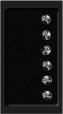
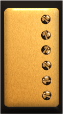
Pickups
multiple selections
Controls
multiple selections
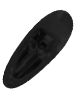
Strap Buttons
one selection
required
Jackplate
one selection
required
priority
- please select one to continue
Note: A Low-Profile Jackplate is countersunk in the side and not visible from the front.
